DOGE Price Prediction: Analyzing the Path to $0.32 Amid Key Support Defense

#DOGE
- DOGE is trading above its 20-day moving average, indicating short-term bullish momentum
- The cryptocurrency is successfully defending critical support at $0.20-$0.21 while eyeing a potential rally toward $0.32
- Market sentiment is cautiously optimistic despite emerging competition from new meme coins
DOGE Price Prediction
Technical Analysis: DOGE Shows Bullish Momentum Above Key Moving Average
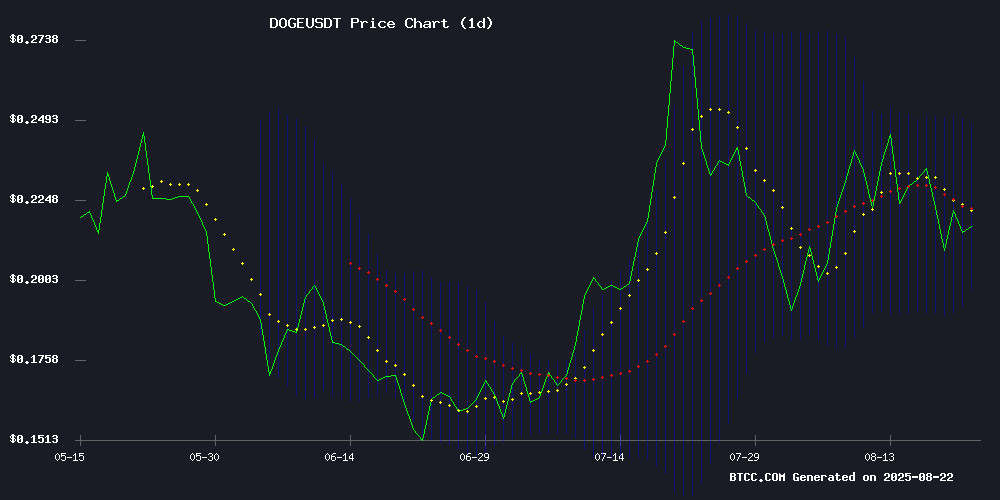
According to BTCC financial analyst Ava, Doge is currently trading at $0.23479, positioned above its 20-day moving average of $0.223251, indicating underlying bullish momentum. The MACD reading of -0.002192, while still negative, shows improving momentum as the histogram narrows. The price sits comfortably within the Bollinger Bands range of $0.197451 to $0.249051, suggesting stable volatility conditions. Ava notes that maintaining above the $0.223 support level could pave the way for further upward movement.
Market Sentiment: Dogecoin Defends Critical Support Amid Renewed Optimism
BTCC financial analyst Ava observes that current news flow surrounding Dogecoin reflects a cautiously optimistic sentiment. The defense of the $0.20-$0.21 support zone, coupled with headlines suggesting a potential rally toward $0.32, indicates growing positive momentum. However, Ava cautions that the mention of 'bearish pressure' and the emergence of new meme coins like Maxi Doge suggest investors should monitor market diversification trends. The overall sentiment aligns with technical analysis, pointing to consolidation with upward potential.
Factors Influencing DOGE's Price
Dogecoin Holds Key Support at $0.20, Eyes $0.32 Rally
Dogecoin (DOGE) has demonstrated resilience by holding above the critical $0.20 support level, a zone reinforced by moving averages and robust trading volume. The meme cryptocurrency's ability to maintain this floor suggests underlying demand and sets the stage for a potential bullish continuation toward $0.32.
Technical indicators paint an optimistic picture. The formation of higher lows points to sustained buying pressure, while increased volume signals fresh capital entering the market. A decisive break above the value area high could accelerate momentum toward the next resistance level.
Market structure remains decidedly bullish despite recent corrective action. DOGE's repeated daily closes above $0.20 confirm the strength of this support level, with the Point of Control and volume nodes providing additional confirmation of the zone's significance.
Dogecoin Tests Critical $0.21 Support Amid Bearish Pressure
Dogecoin's price hovers at $0.2152 after a 3% daily decline, testing the pivotal $0.21 support level that has historically served as a springboard for recoveries. Failure to hold this floor risks accelerating losses toward the Bollinger Band's lower boundary at $0.1924.
Technical indicators skew bearish, with the MACD signaling downward momentum and RSI at 47.33 lingering below neutrality. Analysts observe miner resilience and network fundamentals could fuel long-term upside, but short-term charts show consecutive lower highs since rejection at $0.24.
From Dogecoin to Maxi Doge: Is the New Meme Coin Era Just Beginning?
Dogecoin, the once-jocular cryptocurrency launched in 2013, now grapples with short-term volatility while analysts eye a potential rebound. Trading at $0.21 after recent declines, the asset shows signs of consolidation rather than capitulation. Ali Martinez highlights a bullish triangle pattern and a TD Sequential buy signal, projecting a 40% surge toward $0.30. Long-term optimism persists, with Surf forecasting a $1 target this year.
Meanwhile, Maxi Doge emerges as a dark horse, blending meme culture with gym-bro aesthetics. Its $1 million presale haul underscores growing appetite for niche tokens. The meme coin market, once dominated by Dogecoin, now faces fragmentation as new entrants like Maxi Doge carve distinct narratives.
Is DOGE a good investment?
Based on current technical and fundamental analysis, DOGE presents a compelling opportunity for risk-tolerant investors. The cryptocurrency is successfully defending crucial support at $0.20-$0.21 while showing technical strength above its 20-day moving average. According to BTCC financial analyst Ava, the combination of technical indicators and positive news sentiment suggests potential for movement toward the $0.32 resistance level.
| Indicator | Current Value | Signal |
|---|---|---|
| Current Price | $0.23479 | Neutral/Bullish |
| 20-Day MA | $0.223251 | Support Level |
| MACD Histogram | -0.002192 | Momentum Improving |
| Bollinger Upper | $0.249051 | Near-term Resistance |
| Bollinger Lower | $0.197451 | Key Support |
However, investors should remain aware of the inherent volatility in meme coins and consider appropriate position sizing.
